5 midcap stocks with upside potential of up to 36%:

 There is nothing wrong in being bullish all the time for one simple reason. As the Indian economy grows at a faster rate, the earnings of companies across different sectors and segments will grow faster and what drives the stock prices finally is the earnings. But yes, given the fact that valuations are high, one needs to be more selective in buying the stocks, because the downward movements like the one which happened in March will keep happening at periodic intervals. So, while being bullish one has to reduce the probability of making a mistake and reducing the risk of decline in capital invested in the market.

In reducing market risks, investors should integrate both quantitative and qualitative criteria to assess stocks, aligning expectations with realistic market performances and avoiding impulsive shifts based on short-term fluctuations. More importantly at this point of time having one thing an investor needs to manage is his expectation that my stocks should give me return in the short term only and if it does not you jump from one ship to another.

Look at companies with a certain level of ROE and ROCE. As the economy grows at a much faster rate there would be companies which will go in for expansions. For a business to expand it is extremely important that they should have a certain level of return in existing business so that when expansion takes place, the short term dip in return on capital does not dent the overall return on ROE and ROCE.

Both these ratios not only financial ratios but also to some extent show the ability of the management in handling the cycles which any business has to deal with.

We look at 5 mid cap stocks which had their latest average SR+ score improve by at least 1 point month on month, had a positive Upside Potential and a rating of "Strong Buy" or "Buy" or a "Hold".

Mid Cap Stocks with Score Improvement Month on Month

Upside Potential - Apr 9, 2024

Avg Score 1M ago

Latest Avg Score

Company Name

Reco

Analyst Count

 Upside Potential %▼

Inst Stake %

1Wk Returns %

3M Returns %

1Y Returns %

Market Cap Rs Cr

Arvind Ltd

Strong Buy

10

9

7

69.1

23.0

8.2

15.3

230.4

7,760

CMS Info Systems

Strong Buy

10

9

5

36.2

43.0

1.9

4.6

38.8

6,448

Home First Finance Co

5

4

Buy

17

31.4

27.6

3.4

1.6

34.9

8,431

Rallis India

8

7

Hold

16

17.8

20.6

6.0

4.5

35.0

5,277

Mahindra Lifespace Developers

4

3

Buy

7

17.4

34.4

3.7

13.2

74.7

9,969

 Calculated from highest price target given by analysts

source: et
These largecaps have 'strong buy' & 'buy' recos and upside potential of more than 20%:

After the correction in the month of March, bulls are making a comeback on the street. Both at the index level and at market breadth levels. But one thing is for sure as corrections and consolidation are part of every bull market we will continue to see them at regular levels. So it is better to stick with the large caps as they are the ones which have a tendency to recover faster and lead the rally.

Refinitiv's Stock Report Plus lists down quality stocks with high upside potential over the next 12 months, having an average recommendation rating of "buy" or "strong buy. The screener applies different algorithms for all ASE and NSE stocks.

The bulls are back on the street and the nifty has touched a new high. While staying bullish it would be better to continue with some checks and balances. The reason, how long bulls are going to stay in control is a question because the issue of high valuations is still not sorted out.

For long term investors it would be worthwhile to understand a fact which comes out of long history is that corrections are part of any bull run. The only thing any investor needs to make sure is that in any corrective phase, fresh investment should be made in large cap stocks as there is a possibility that they would see less damage in correction.

In the near term some more profit booking cannot be ruled out in sectors on a rational basis.

In the final step, only stocks with a minimum market capitalisation of Rs 25,000 cr are kept in the list and the rest are discarded.

Large Cap Upside Potential

Apr 9, 2024

Company Name

Reco

Analyst Count

27

Bandhan Bank

Buy

36.8

Dalmia Bharat

Buy

28

HDFC Bank

Buy

42

UPL

Buy

26

42

Dabur India

Buy

Hindustan Unilever

Buy

40

36.8

Dalmia Bharat

Buy

28

HDFC Bank

Buy

42

UPL

Buy

26

42

Dabur India

Buy

Hindustan Unilever

Buy

40

Source: SR Plus

MarketCap Rs Cr

Upside Potential %

29,795

25.3

37,735

24.1

1,174,520

23.1

36,675

20.9

89,134

20.8

source: et
फार्मा और आईटी सेक्टर में तेजी के साथ ही अगले प्रदर्शनकर्ता की तलाश जारी है। क्या बैंकिंग क्षेत्र आगे रहेगा?

फार्मा और आईटी सेक्टर ने 2020 की बड़ी तेजी की अगुवाई की, लेकिन अब लगता है कि उनका रिटर्न अधिकतम हो गया है। पिछले तीन महीनों में फार्मा में गिरावट आई है और आईटी ने निफ्टी से कम प्रदर्शन किया है। ईटी प्राइम ने गिरते शेयरों का पता लगाने के लिए लार्ज-कैप, मिड-कैप और स्मॉल-कैप की दुनिया पर नज़र डाली, जो भविष्य में सबसे अच्छा रिटर्न नहीं दे सकते हैं।

फार्मा और आईटी स्टॉक कोविड-19 के बाद की दुनिया के 'बदला लेने वाले' बन गए हैं।  पिछले एक साल में, NSE फार्मा इंडेक्स 52% बढ़ा है, जबकि IT इंडेक्स 61% उछला है, जबकि निफ्टी 50 में 32% की बढ़त हुई है। सभी प्रमुख फार्मा और IT स्टॉक निफ्टी 50 का हिस्सा हैं। उदाहरण के लिए, केवल एक फार्मा स्टॉक (डॉ रेड्डीज) और पाँच IT स्टॉक का संयुक्त रूप से निफ्टी 50 में लगभग 22% भार है। हालाँकि, यह उन क्षेत्रों में निवेश करने का सबसे अच्छा समय नहीं हो सकता है, जिनका मूल्यांकन पहले ही आसमान छू चुका है।

यह देखते हुए कि आप 2015 से फार्मा इंडेक्स में निवेशक हैं, आपको किस तरह का रिटर्न मिलता? इसका उत्तर है कि सालाना मात्र 0.32%। IT इंडेक्स के लिए, यह निफ्टी 50 के 10% के मुकाबले 12% होगा।

जबकि फार्मा और IT स्टॉक ने पिछले 12 महीनों में अच्छा रिटर्न दिया है, अब दरारें उभर रही हैं। पिछले तीन महीनों में, फार्मा सेक्टर में गिरावट आई है। IT और फार्मा दोनों सेक्टर बेंचमार्क इंडेक्स से कम प्रदर्शन कर रहे हैं।  हमने ET Prime में लार्ज-कैप, मिड-कैप और स्मॉल-कैप शेयरों के डेटा को देखा ताकि पता लगाया जा सके कि पिछले एक साल में सबसे अच्छा रिटर्न देने वाली कंपनियों के साथ क्या हो रहा है और क्या वे अगले साल अच्छा प्रदर्शन कर सकती हैं।

लार्ज-कैप यूनिवर्स

कंपनी का नाम

कंपनी का मार्केट कैप (करोड़ रुपये)

कीमत बंद (रुपये में)

52-सप्ताह का रिटर्न

6 महीने का रिटर्न

3 महीने का रिटर्न

52-सप्ताह के उच्चतम स्तर से नीचे

TCS

1,081,677

2.924.2

47.42

30.09

8.21

13.34

इन्फोसिस

537,663

1267

75.5

35.44

13.94

10.02

HCL  टेक्नोलॉजीज

विप्रो

252,466

930.35

72.63

30.18

11.07

14,77

226,219

414.4

85.7

51.16

17.32

12.23

अल्ट्राटेक सीमेंट

183,587

6,365.05

45.37

50.52

27.34

7.19

हिंदुस्तान जिंक

126,823

300.15

107.84

42.99

29.52

9.41

महिंद्रा एंड महिंद्रा

97,762

819.45

77.16

27.72

11.69  15.3

जेएसडब्ल्यू स्टील

97,430

405.1

69.51

40.88

12.92

7.3

अडानी ट्रांसमिशन

83,371

758.05

197.74

172.08

99.31 8.54

ग्रासिम इंडस्ट्रीज

83,121

1,265.95

75.79

71.26

37.12 6.84

डॉ. रेड्डीज लैबोरेटरीज

73,899

4,453.4

52.2

1.19

-8.33

19.7

आयशर  मोटर्स

69,871

2,556.15

51.75

12.87

-1.42

17.73

हैवेल्स इंडिया

69,617

1,112.15

82.07

73.38

38.3

10.26

हीरो मोटोकॉर्प

66,930

3,350.2

61.79

7.51

5.8 11.16

इन्फो एज (भारत)

63,160

4,909.8

89.34

44.85

14.03

16.49

source: et
2023 में 48% सक्रिय लार्ज-कैप फंड बेंचमार्क से आगे निकल गए, जबकि एक साल पहले यह आंकड़ा 12% था:

SPIVA की रिपोर्ट के अनुसार, 75.4% मिड-और स्मॉल-कैप फंड S&P BSE 400 मिडस्मॉलकैप इंडेक्स से पीछे रह गए हैं। हालांकि, सक्रिय रूप से प्रबंधित लार्ज-कैप फंड के प्रदर्शन में सुधार हुआ है। रिपोर्ट के अनुसार, रियल एस्टेट, यूटिलिटीज और कंज्यूमर डिस्क्रिप्शनरी पर अधिक वजन होने से कई लार्ज-कैप फंड को व्यापक बाजार से बेहतर प्रदर्शन करने में मदद मिली है।

2023 में, लार्ज-कैप स्पेस में 48% फंड मैनेजर सालाना आधार पर अपने बेंचमार्क इंडेक्स से बेहतर प्रदर्शन करने में कामयाब रहे हैं। 2022 में, यही संख्या 12% से थोड़ी अधिक थी। हालांकि, तीन और पांच साल की अवधि में, उनमें से 87.5% और 85.7% (क्रमशः) ने खराब प्रदर्शन किया है।

लेकिन असली बड़ा आश्चर्य मिड- और स्मॉल-कैप स्पेस से आता है। यह एक ऐसा सेगमेंट है जहां सभी ने माना था कि सक्रिय फंड हमेशा अच्छा प्रदर्शन करेंगे।  लेकिन इस साल अब तक, 73.6% मिड- और स्मॉल-कैप फंड ने वास्तव में खराब प्रदर्शन किया है। 10 साल के आधार पर भी, डेटा इतना उत्साहजनक नहीं है।

लार्ज-कैप स्पेस में सबसे बड़े फंड आईसीआईसीआई प्रूडेंशियल ब्लूचिप (डायरेक्ट) का एयूएम (एसेट अंडर मैनेजमेंट) 55,000 करोड़ रुपये है। 2023 के लिए, फंड ने बीएसई 100 इंडेक्स के 26% की तुलना में 28% रिटर्न दिया। फंड अपने आकार के बावजूद लगभग दो साल लगातार इंडेक्स से बेहतर प्रदर्शन करने में कामयाब रहा है। बेहतर प्रदर्शन का मुख्य कारण फंड मैनेजरों द्वारा वर्षों से अपनाए गए मूल्य-आधारित निवेश दर्शन है।

आईसीआईसीआई प्रूडेंशियल ब्लूचिप (डायरेक्ट) ने पिछले साल आईसीआईसीआई बैंक (9.43%), रिलायंस इंडस्ट्रीज (8.12%) और एलएंडटी (6%) में बहुत अधिक निवेश किया था। पिछले एक साल में, रिलायंस इंडस्ट्रीज ने 37% और एलएंडटी ने 75% रिटर्न दिया है, जिससे फंड को असाधारण रिटर्न देने में मदद मिली है।

 सामान्य तौर पर, वैल्यू फिलॉसफी वाले लार्ज-कैप फंड्स का समय अच्छा चल रहा है। बेहतर प्रदर्शन के मामले में लार्ज-कैप फंड्स के लिए यह सबसे अच्छा साल रहा है और जब तक वैल्यू-टर्न-मोमेंटम उनके पक्ष में रहेगा, तब तक ऐसा होता रहेगा।

बढ़ते सेक्टर्स पर दांव लगाना:
फंड मैनेजर्स के अनुसार, 2023 में स्थिर ब्याज दर परिदृश्य और कमोडिटी की कीमतों ने बड़े कॉरपोरेट्स को समग्र बाजार से बेहतर प्रदर्शन करने के लिए प्रेरित किया। यह दर्शाता है कि यह चुनना कितना महत्वपूर्ण है कि किन उद्योगों में निवेश करना है। यह सक्रिय प्रबंधकों को सही सेक्टर चुनकर अधिक पैसा कमाने का मौका देता है।

 एसएंडपी डॉव जोन्स इंडेक्स के इंडेक्स इन्वेस्टमेंट स्ट्रैटेजी के निदेशक बेनेडेक वोरोस ने कहा, "जैसा कि हम पिछले साल पर विचार करते हैं, बाजार की ताकत स्पष्ट है, एसएंडपी बीएसई 100 और एसएंडपी बीएसई 200 सूचकांकों ने क्रमशः 23.2% और 24.5% की बढ़त दर्ज की है। यह प्रदर्शन भारतीय बाजारों के लिए एक महत्वपूर्ण वर्ष को रेखांकित करता है, जो एक व्यापक आर्थिक माहौल द्वारा बनाए रखा गया है जिसमें ब्याज दरें और कमोडिटी की कीमतें स्थिर हुई हैं।"

2022 के साथ तुलना स्पष्ट है: जहां पिछले वर्ष, सूचकांक में 2.2% की मामूली वृद्धि देखी गई थी, और केवल 54.9% सक्रिय रूप से प्रबंधित मिड- और स्मॉल-कैप फंड पीछे रह गए थे।

दिसंबर 2023 को समाप्त 10-वर्ष की अवधि में, इनमें से 75.4% फंड एसएंडपी बीएसई 400 मिडस्मॉलकैप इंडेक्स से पीछे रहे।  यह 2022 से एकदम उलट है, जहां 2023 में उनमें से ठीक 50% ने बेंचमार्क से बेहतर प्रदर्शन किया था। SPIVA रिपोर्ट कहती है कि रियल एस्टेट, यूटिलिटीज और कंज्यूमर डिस्क्रिप्शनरी पर ज़्यादा वज़न रखने और टेक्नोलॉजी, मटीरियल और बैंकों पर कम वज़न रखने से कई लार्ज-कैप फंड को व्यापक बाज़ार से बेहतर प्रदर्शन करने में मदद मिली है। रिपोर्ट से पता चलता है कि रियल एस्टेट ने अच्छा प्रदर्शन किया, जबकि बैंक पिछड़ गए। हालांकि, दो वर्षों के बीच लंबी अवधि के अंडरपरफॉर्मेंस की दरें अपेक्षाकृत स्थिर रहीं, जो लंबी अवधि में अल्फा उत्पन्न करने में सक्रिय प्रबंधकों के लिए लगातार चुनौतियों का संकेत देती हैं। टैक्स-सेविंग श्रेणी में, ELSS फंड सबसे आगे रहे, जिनमें से सिर्फ़ 30% ने S&P BSE 200 से कम प्रदर्शन किया, जो 2023 में 24.5% बढ़ा। हालांकि, लंबी अवधि के अंडरपरफॉर्मेंस का रुझान और खराब हो गया, जिसमें 10 साल की अवधि में 67.6% फंड बेंचमार्क से पिछड़ गए।  ELSS फंड्स ने 2023 में उल्लेखनीय सुधार दिखाया, 2022 की तुलना में अंडरपरफॉर्मेंस दरों में पर्याप्त कमी आई, जहाँ 76.9% फंड इंडेक्स को मात देने में विफल रहे।

सरकारी बॉन्ड:
भारतीय सरकारी बॉन्ड फंड्स के प्रदर्शन में 2022 की तुलना में 2023 में थोड़ी गिरावट देखी गई, जिसमें कम प्रबंधक सभी समय क्षितिजों में बेहतर प्रदर्शन करने में सक्षम थे।

2023 में सक्रिय प्रबंधकों में से एक-पांचवें से भी कम ने 81.5% की अंडरपरफॉर्मेंस दर के साथ S&P BSE इंडिया गवर्नमेंट बॉन्ड इंडेक्स को मात दी। इस श्रेणी के लिए बेंचमार्क S&P BSE इंडिया गवर्नमेंट बॉन्ड इंडेक्स में 2023 में 7.9% की वृद्धि हुई।

भारतीय कंपोजिट बॉन्ड फंड्स के लिए अंडरपरफॉर्मेंस दरें 2022 की तुलना में 2023 में बढ़ीं, जो इस श्रेणी में सक्रिय प्रबंधकों के लिए महत्वपूर्ण चुनौतियों का संकेत देती हैं।

भारतीय कंपोजिट बॉन्ड फंड मैनेजर्स ने 2023 में सभी श्रेणियों में सबसे अधिक अंडरपरफॉर्मेंस दर 95.6% दर्ज की।

source:et
LTIMindtree: नज़रें अगले CEO पर हैं, लेकिन निवेशकों को उम्मीदों को फिर से तय करने की ज़रूरत है, लेकिन क्यों:

जबकि LTIMindtree का बोर्ड अपनी अप्रैल की बैठक में आगामी प्रबंधन परिवर्तन पर चर्चा करने की तैयारी कर रहा है, कंपनी के सामने आने वाली चुनौतियों और उनसे निपटने के तरीकों पर नज़र डालें।

पिछले साल के अंत में, LTIMindtree का वरिष्ठ प्रबंधन कंपनी की वार्षिक रणनीति बैठक के लिए लंदन में इकट्ठा हुआ था - इंजीनियरिंग दिग्गज L&T द्वारा बेंगलुरु स्थित IT फ़र्म Mindtree के शत्रुतापूर्ण अधिग्रहण के बाद पहली बार। बैठक के लिए विकास में मंदी शीर्ष एजेंडा था, लेकिन कमरे में हाथी संभावित प्रबंधन परिवर्तन था।

सीईओ देबाशीष चटर्जी 2025 में अपना कार्यकाल समाप्त होने पर लगभग 60 वर्ष के होंगे, और आम धारणा यह थी कि वे सेवानिवृत्त हो जाएंगे। अधिग्रहण के बाद Mindtree को चलाना और विलय की देखरेख करना कठिन था। और कॉग्निजेंट से आए किसी व्यक्ति के लिए, L&T ढांचे के भीतर काम करना उसकी अपेक्षा से कहीं अधिक कठिन था, मामले की प्रत्यक्ष जानकारी रखने वाले एक सूत्र ने ET प्राइम को बताया।

 LTIMindtree के पास निश्चित रूप से CEO की भूमिका के लिए संभावित उम्मीदवारों की कोई कमी नहीं थी। सूत्रों के अनुसार, मुख्य परिचालन अधिकारी नचिकेत देशपांडे और बिक्री के अध्यक्ष सुधीर चतुर्वेदी दोनों ही इस पद के लिए दावेदार हैं। वास्तव में, कुछ मीडिया रिपोर्टों के अनुसार, देशपांडे "प्रतीक्षारत CEO" हैं।

लेकिन कंपनी के भीतर प्रतिस्पर्धा ऐसे समय में मुश्किलें खड़ी कर रही है, जब LTIMindtree विकास की चुनौतियों का सामना कर रही है। विश्लेषकों का कहना है कि विलय अभी पूरा नहीं हुआ है और इसके तालमेल के लक्ष्य को पीछे धकेलना पड़ सकता है।

LTIMindtree के एक पूर्व कार्यकारी ने ET Prime को बताया, "यह व्यक्तियों की कंपनी है, जो एक-दूसरे के साथ प्रतिस्पर्धा कर रहे हैं। यह एक कंपनी के रूप में काम नहीं करती है।"

LTI-Mindtree विलय भारत के IT उद्योग के इतिहास में एक ऐतिहासिक सौदा था। एक मजबूत IT व्यवसाय बनाना लंबे समय से L&T के पूर्व अध्यक्ष एएम नाइक का सपना रहा है, जबकि वर्तमान अध्यक्ष एसएन सुब्रमण्यन व्यवसाय में सक्रिय रूप से शामिल हैं और नियमित रूप से IT फर्म के ग्राहकों से मिलते रहते हैं।

 नचिकेत डीसी (देबाशीष चटर्जी) के करीबी हैं। वे कॉग्निजेंट में साथ काम कर चुके हैं। सुधीर (चतुर्वेदी) लगातार खुद को एलएंडटी के करीबी के तौर पर पेश कर रहे हैं। स्वाभाविक रूप से, जब तक वे कोई निर्णय नहीं लेते, तब तक कुछ नाटक तो होगा ही," एलटीआईमाइंडट्री के एक अधिकारी ने नाम न बताने की शर्त पर कहा। उन्होंने आगे कहा कि जिसे शीर्ष पद नहीं मिलता, उसके जाने की संभावना है।

source: et
भारतीय आईटी कंपनियों ने क्लाउड की लहर पर सवार होकर काम किया; हाइपरस्केलर्स की वृद्धि में कमी आई:

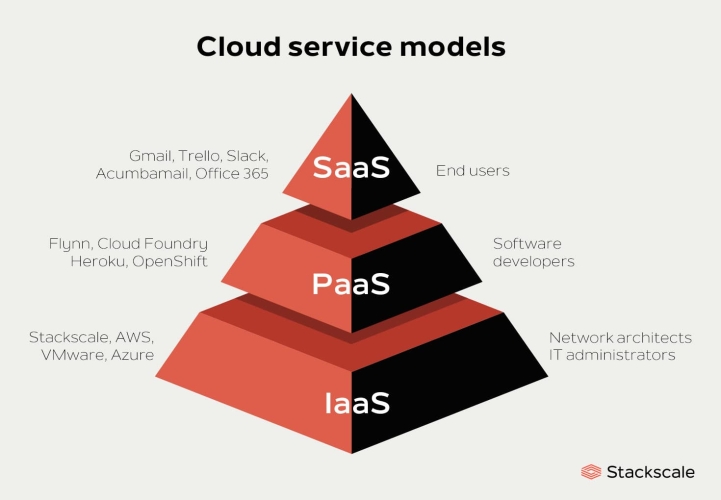
आईटी कंपनियों की बिक्री पाइपलाइनों में क्लाउड सेवाओं का हिस्सा दो अंकों का है। क्लाउड की ओर हर कदम में डेटा और प्रक्रियाओं के हस्तांतरण की देखरेख करने वाला एक आईटी प्लेयर शामिल होता है। जैसे-जैसे हाइपरस्केलर्स बढ़े, भारतीय आईटी फर्म भी उनके साथ बढ़ीं। लेकिन पिछली चार तिमाहियों से विकास धीमा होने के साथ, क्लाउड इकाइयों पर इसका क्या प्रभाव पड़ेगा?

महामारी के शुरुआती दिनों में, ऐसा लग रहा था कि बड़े हाइपरस्केलर्स- Amazon Web Services, Microsoft Azure और Google Cloud के लिए विकास कभी खत्म नहीं होगा।

उन्होंने एंटरप्राइज़-सेल्स टीमों में निवेश करने और आईटी कंपनियों के साथ साझेदारी करने में कई साल बिताए थे और इसका फ़ायदा मिलना शुरू हो गया था। विकास इतना अच्छा था कि आंतरिक टीमों को अपने सर्वर के उपयोग के साथ सावधान रहने के लिए कहा गया ताकि ग्राहकों को बेचने के लिए हमेशा अतिरिक्त क्षमता बनी रहे। आंतरिक ऑडिट सख्त हो गए, जिससे एक क्लाउड प्रदाता को पता चला कि उसके कुछ युवा कर्मचारी बिटकॉइन माइन करने के लिए कुछ सर्वर का उपयोग कर रहे थे।

हाइपरस्केलर्स की वृद्धि उनके क्लाउड व्यवसायों में बड़े भारतीय आईटी निवेश के साथ हुई।  क्लाउड की ओर हर कदम में डेटा और प्रक्रियाओं के हस्तांतरण की देखरेख करने वाला एक आईटी प्लेयर शामिल होता है। इसलिए, जैसे-जैसे क्लाउड कंपनियाँ बढ़ीं, भारतीय आईटी फ़र्म भी उनके साथ-साथ खुशी-खुशी बढ़ीं।

लेकिन पिछली चार तिमाहियों से विकास धीमा रहा है। 31 दिसंबर, 2022 को समाप्त तिमाही की स्थिति इस प्रकार है:

• AWS में साल-दर-साल 20% की वृद्धि हुई, जबकि Q3 FY22 में यह 28% थी। क्लाइंट ने अपने उपयोग को बढ़ाने के बजाय मौजूदा कार्यभार को अनुकूलित करने पर ध्यान केंद्रित किया, जिससे कमी आई।

Azure में साल-दर-साल 31% की वृद्धि हुई, जबकि Q3 FY22 में यह 35% थी। Azure की वाणिज्यिक बुकिंग वृद्धि दर पाँच वर्षों में सबसे कम थी।

Google में साल-दर-साल 36% की वृद्धि हुई, जबकि Q3 FY22 में यह 42% थी। Google ने बड़ी कंपनियों के साथ बेहतर गति देखी, लेकिन क्लाउड व्यवसाय में अभी भी इसका मार्जिन नकारात्मक है।

प्रारंभिक क्लाउड सौदों में आमतौर पर एक रूपरेखा समझौता शामिल होता है। इसका मतलब है कि एक निर्दिष्ट समय अवधि में खर्च के एक निश्चित स्तर के लिए प्रतिबद्धता।  लेकिन प्रतिबद्धता का मतलब यह नहीं है कि पैसा अपने आप आ जाएगा।

आईएसजी के विश्लेषक स्टैंटन जोन्स ने एक शोध नोट में कहा, "यह खर्च तभी पूरा हो सकता है जब सेवाओं का उपभोग किया जाए, जिसका मतलब है कि प्रतिबद्धता की समयसीमा के साथ मेल खाने के लिए अनुप्रयोगों को तेज़ी से आगे बढ़ाना, बनाना और बढ़ाना होगा। मैक्रोइकॉनोमिक तस्वीर के साथ इसका मतलब है कि कंपनियाँ अब अपने पास मौजूद चीज़ों को अनुकूलित करने पर ध्यान केंद्रित कर रही हैं - बजाय इसके कि वे नई चीज़ें खरीदें।"

source:et
स्टॉक रडार: अप्रैल के पहले सप्ताह में आदित्य बिड़ला कैपिटल 16% उछलकर 52-सप्ताह के उच्चतम स्तर पर पहुंचा:

विशेषज्ञों ने सुझाव दिया कि अल्पकालिक व्यापारी अगले 1-2 महीनों में 245 रुपये के लक्ष्य के लिए अभी या गिरावट पर स्टॉक खरीदने पर विचार कर सकते हैं

यह स्टॉक दैनिक चार्ट पर 5,10,30,50,100 और 200-डीएमए जैसे सबसे महत्वपूर्ण अल्पकालिक और दीर्घकालिक मूविंग एवरेज से ऊपर कारोबार कर रहा है। यह बुल्स के लिए एक सकारात्मक संकेत है। इसने पिछले सप्ताह 3 जुलाई, 2023 को 199.40 रुपये के अपने स्विंग हाई को पार कर लिया। यह 5 अप्रैल को 204.70 रुपये पर बंद हुआ।

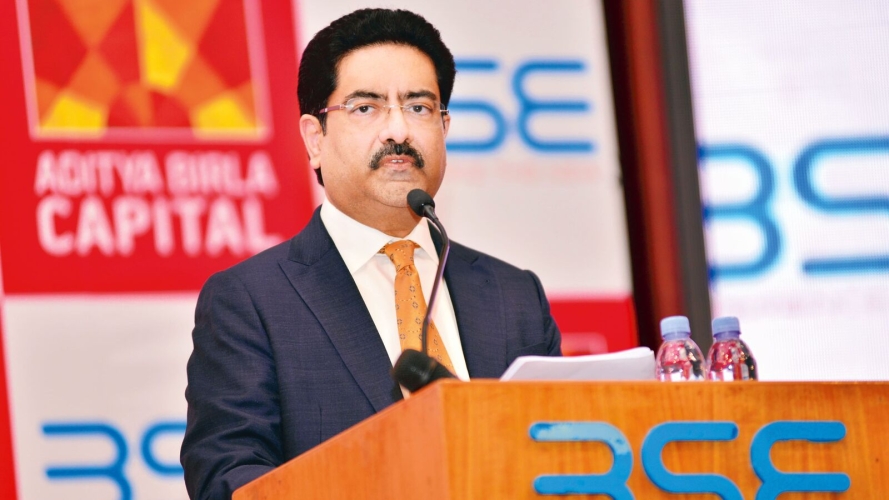
निवेश उद्योग का एक हिस्सा आदित्य बिड़ला कैपिटल ने अप्रैल के पहले सप्ताह में एक सप्ताह में 16% से अधिक की तेजी के साथ 52-सप्ताह के नए उच्च स्तर को छुआ। मूल्य संरचना से पता चलता है कि रैली अभी खत्म नहीं हुई है।

 विशेषज्ञों ने सुझाव दिया कि अल्पकालिक व्यापारी अगले 1-2 महीनों में 245 रुपये के लक्ष्य के लिए अभी या गिरावट पर शेयर खरीदने पर विचार कर सकते हैं।

शेयर 28 मार्च को 175.40 रुपये से बढ़कर 5 अप्रैल को 208.80 रुपये पर पहुंच गया, जो एक सप्ताह में 16% से अधिक की तेजी को दर्शाता है।

इस गति को ट्रैक करते हुए, शेयर ने 4 अप्रैल को 208.60 रुपये के नए 52-सप्ताह के उच्च स्तर को छुआ। विशेषज्ञों ने सुझाव दिया कि व्यापारी 200 के स्तर तक गिरावट पर शेयर को जमा करने पर विचार कर सकते हैं।

आदित्य बिड़ला कैपिटल का शेयर दैनिक चार्ट पर 5,10,30,50,100 और 200-डीएमए जैसे अधिकांश महत्वपूर्ण अल्पकालिक और दीर्घकालिक मूविंग एवरेज से ऊपर कारोबार कर रहा है, जो बुल्स के लिए एक सकारात्मक संकेत है।

इसने पिछले सप्ताह 3 जुलाई, 2023 को अपने स्विंग हाई 199.40 रुपये को पार कर लिया।  5 अप्रैल को शेयर 204.70 रुपये पर बंद हुआ।

रेलिगेयर ब्रोकिंग लिमिटेड के तकनीकी शोध के वरिष्ठ उपाध्यक्ष अजीत मिश्रा ने कहा, "हम वित्तीय क्षेत्र में मिश्रित रुझान देख रहे हैं और एबी कैपिटल ने उतार-चढ़ाव के बीच उल्लेखनीय मजबूती दिखाई है।"

उन्होंने कहा, "इसने हाल ही में 6 महीने लंबे समेकन चरण को समाप्त किया है, जिसमें वॉल्यूम में तेज उछाल आया है, जिससे अपट्रेंड को और मजबूती मिली है।"

मिश्रा ने सुझाव दिया, "स्थितिगत व्यापारी और अल्पकालिक निवेशक 200-210 रुपये की दी गई सीमा में धीरे-धीरे संचय करने पर विचार कर सकते हैं। व्यापारी 1-2 महीने में 245 रुपये के लक्ष्य के लिए खरीद सकते हैं। समापन के आधार पर स्टॉप लॉस 188 रुपये से नीचे रखा जा सकता है।"

source: et
As pharma,IT sectors run their course,hunt for the next performer is on. Will banking stand out?

Pharma and IT sectors led the big bull rally of 2020, but now their returns seem to have maxed out. Over the last three months, pharma has been on a free-fall, and IT underperformed the Nifty, ET Prime looked at the large-cap, mid-cap, and small-cap universe to find out falling stocks that may not give best returns in future.

Pharma and IT stocks have turned out to be the 'avengers' of the post-Covid-19 world. Over the last one year, the NSE Pharma Index is up 52% while the IT index has jumped 61% as against a 32% gain in Nifty 50. All major pharma and IT stocks are part of the Nifty 50. For instance, just one pharma stock (Dr Reddy's) and five IT stocks account for around a combined 22% weightage in the Nifty 50. However, this may not be the best time to invest in sectors that have already gone up with their valuations skyrocketing.

Considering you have been an investor in the pharma index since 2015, what kind of returns would you have made? The answer is a mere 0.32% annually. For the IT index, it would be 12% as against Nifty 50's 10%.

While pharma and IT stocks have given good returns over the last 12 months, cracks are now emerging. Over the last three months, the pharma sector has been on a free-fall. Both IT and pharma sectors are underperforming the benchmark index. We at ET Prime looked at the data of large-cap, mid-cap, and small-cap stocks to find out what has been happening to companies that gave the best returns over the last one year, and whether they can perform next year.

The large-cap universe

Company name

Company market cap (INR crore)

Price close (INR)

52-week returns

6-month returns

3-month returns

below 52-week high

TCS

1,081,677

2.924.2

47.42

30.09

8.21

13.34

Infosys

537,663

1267

75.5

35.44

13.94

10.02

HCL Technologies

Wipro

252,466

930.35

72.63

30.18

11.07

14,77

226,219

414.4

85.7

51.16

17.32

12.23

UltraTech Cement

183,587

6,365.05

45.37

50.52

27.34

7.19

Hindustan Zinc

126,823

300.15

107.84

42.99

29.52

9.41

Mahindra and Mahindra

97,762

819.45

77.16

27.72

11.69 15.3

JSW Steel

97,430

405.1

69.51

40.88

12.92

7.3

Adani Transmission

83,371

758.05

197.74

172.08

99.31 8.54

Grasim Industries

83,121

1,265.95

75.79

71.26

37.12 6.84

Dr. Reddy's Laboratories

73,899

4,453.4

52.2

1.19

-8.33

19.7

Eicher Motors

69,871

2,556.15

51.75

12.87

-1.42

17.73

Havells India

69,617

1,112.15

82.07

73.38

38.3

10.26

Hero MotoCorp

66,930

3,350.2

61.79

7.51

5.8 11.16

Info Edge (India)

63,160

4,909.8

89.34

44.85

14.03

16.49


source: et
48% active large-cap funds beat benchmark in 2023 vs 12% a year ago:

As per a SPIVA report, 75.4% of the mid-and small-cap funds have lagged the S&P BSE 400 MidSmallCap Index. However, the performance of actively managed large-cap funds has improved. According to the report, being overweight on real estate, utilities, and consumer discretionary have helped a slew of large-cap funds to outperform the broader market.

In 2023, 48% fund managers in the large-cap space have managed to outperform their benchmark index on yearly basis. In 2022, the same number was little over 12%. However, on a three- and five-year period, 87.5% and 85.7% (respectively) of them have underperformed.

But the real big surprise comes from mid- and the small-cap space. This is a segment where everyone assumed active funds would always do well. But this year so far, 73.6% of mid- and small-cap funds have actually underperformed. Even on a 10-year basis, the data is not so encouraging.

ICICI Prudential Bluechip (Direct), the biggest fund in the large-cap space, has an AUM (asset under management) of INR55,000 crore. For 2023, the fund returned 28% as compared to 26% for the BSE 100 Index. The fund has managed to outperform the index almost two years in a row despite its size. The primary reason for the outperformance is the value-based investment philosophy that fund managers have followed over the years.

ICICI Prudential Bluechip (Direct) had a huge exposure to ICICI Bank (9.43%), Reliance Industries (8.12%) and L&T (6%) last year. In the past one year, Reliance Industries has returned 37%, and L&T 75%, which helped the fund to give extraordinary returns.

In general, large-cap funds with value philosophy are having their time in the sun. This has been one of the best years for large-cap funds in terms of outperformance and will continue to do so as long as the value-turned- momentum remains in their favour.

Betting on booming sectors:
According to fund managers, the stable interest-rate scenario and commodity prices in 2023 led big corporates to do better than the overall market. This shows how important it is to choose which industries to invest in. It gives active managers a chance to make more money by picking the right sectors.

Benedek Voros, director, Index Investment Strategy, S&P Dow Jones Indices, said, "As we reflect on the past year, the market's vigour is unmistakable, with the S&P BSE 100 and S&P BSE 200 indices posting gains of 23.2% and 24.5%, respectively. This performance underlines a pivotal year for Indian markets, sustained by a macroeconomic
environment that has seen interest rates and commodity prices stabilising."

The comparison with 2022 is stark: where in the previous year, the index saw a modest rise of 2.2%, and only 54.9% of actively manged mid- and small-cap funds lagged.

Over the 10-year period ended December 2023, a significant 75.4% of these funds trailed the S&P BSE 400 MidSmallCap Index. This marks a stark reversal from 2022, where exactly 50% of them had outperformed the benchmark in 2023.

In 2023, 51.6% of actively managed Indian equity large-cap funds underperformed the S&P BSE 100, which experienced a notable gain of 23.2%. A significant improvement was observed in the short-term performance of Indian equity large-cap funds in 2023 compared to 2022, where 88% of funds underperformed the benchmark.

The SPIVA report says being overweight on real estate, utilities, and consumer discretionary and staying underweight on technology, materials, and banks have helped a slew of large-cap funds to outperform the broader market. The report shows that real estate did well, while banks were laggards.

However, the long-term underperformance rates remained relatively consistent between the two years, indicating persistent challenges for active managers in generating alpha over extended periods.

In the tax-saving category, ELSS funds stood out with just 30% of them underperforming the S&P BSE 200, which rose by 24.5% in 2023. However, the long-term underperformance trend worsened, with 67.6% of funds lagging the benchmark over a 10-year period.

ELSS funds showcased marked improvement in 2023, with a substantial decrease in underperformance rates compared to 2022, where 76.9% of funds failed to beat the index.

Government bond:
The performance of Indian government bond funds witnessed a slight deterioration in 2023 compared to 2022, with fewer managers able to outperform across all time horizons.

Less than one-fifth of active managers beat the S&P BSE India Government Bond Index in 2023, with an underperformance rate of 81.5%. The S&P BSE India Government Bond Index, the benchmark for the category,
increased 7.9% in 2023.

In the medium term, active Indian government bond funds showed relatively better performance, with underperformance rates of 75% over three years and 64% over five years. However, over a span of 10 years, a significant 90% of active funds failed to outperform the benchmark.

The underperformance rates for Indian composite bond funds surged in 2023 compared to 2022, indicating significant challenges for active managers in this category.

Indian composite bond fund managers recorded the highest underperformance rate across all categories in 2023,at 95.6%.

source: et




Apr 10 2024, 08:50
- Whatsapp
- Facebook
- Linkedin
- Google Plus
0