Jharkhand48

Apr 02 2024, 10:12

5 पीएसयू बैंक जिनमें 24% तक की उछाल की संभावना है:

मार्च के बाजार में गिरावट में, शुरुआती गिरावट पीएसयू के नेतृत्व में हुई। पीएसयू बैंक और गैर-बैंक पीएसयू दोनों। यह देखते हुए कि दोनों ही बैंकों ने तेजी से लाभ कमाया, मुनाफावसूली स्वाभाविक थी। लेकिन अगर व्यापक रूप से देखा जाए तो यह स्पष्ट है कि पीएसयू बैंकों में गिरावट तो आई, लेकिन गिरावट की तीव्रता बहुत अधिक नहीं थी। 

उदाहरण के लिए, अगर 2023 में 100% से अधिक की बढ़त के बाद, स्टॉक में 10-15% की गिरावट आती है, तो यह तेजी का संकेत है, मंदी का नहीं। अगर तालिका को देखें, तो सभी समय-सीमाओं में चयनित पीएसयू ने सकारात्मक रिटर्न दिया है, सिवाय एक स्टॉक के, जहां 1 महीने का रिटर्न नकारात्मक है। यह प्रवृत्ति आम तौर पर तब देखी जाती है जब सकारात्मक मौलिक परिवर्तनों के आधार पर डिलीवरी-आधारित खरीदारी अधिक होती है। जैसे-जैसे अर्थव्यवस्था उच्च विकास के पथ पर आगे बढ़ रही है, वे थीम पर खेलने के लिए शायद सबसे अच्छे हैं, अगर आप ऐतिहासिक बोझ को दूर करने में सक्षम हैं जो कभी-कभी स्ट्रीट पर पड़ता है।

 पीएसयू बैंकों के शेयर एक साल से भी ज़्यादा समय से अच्छा प्रदर्शन कर रहे हैं, लेकिन पीएसयू और निजी क्षेत्र के बैंकों के प्रदर्शन में अंतर की वजह से पीएसयू बैंकों पर ज़्यादा चर्चा हुई है।

यह देखते हुए कि शेयरों ने अच्छा प्रदर्शन किया है और इसकी तुलना इस तथ्य से की जानी चाहिए कि सिर्फ़ एक साल पहले वे आज की तुलना में बहुत कम कीमत पर बिक रहे थे, क्या यह प्रदर्शन बरकरार रहेगा। हाल ही में जब बाजार में कुल मिलाकर सुधार हुआ, तो इन पीएसयू बैंकों में भी गिरावट देखी गई। लेकिन अगर कोई सुधार के व्यापक स्वरूप को देखता है तो यह बहुत स्पष्ट है कि पीएसयू बैंकों में सुधार तो हुआ, लेकिन सुधार की मात्रा बहुत ज़्यादा नहीं थी। उदाहरण के लिए, अगर पिछले एक साल में 100% से ज़्यादा की बढ़त के बाद शेयर में 10 से 15% की गिरावट आती है, तो यह मंदी की बजाय तेज़ी का संकेत है। वास्तव में अगर कोई तालिका को देखे, तो सभी समय-सीमाओं में चयनित पीएसयू शेयर सकारात्मक रिटर्न देने में सक्षम रहे हैं, सिवाय एक शेयर के जहां एक महीने का रिटर्न नकारात्मक रहा।  यह प्रवृत्ति आम तौर पर तब देखी जाती है जब किसी क्षेत्र के बुनियादी सिद्धांतों में सकारात्मक बदलाव के आधार पर अधिक डिलीवरी आधारित खरीदारी होती है, जैसा कि पीएसयू बैंकों के मामले में हुआ है।

तथ्य यह है कि ये बैंक लगभग नौ वर्षों से पुनर्गठन और पुनर्निर्माण की प्रक्रिया से गुजरे हैं, जिसके माध्यम से उन्होंने कोविड, विलय और ऋण देने के मामले में निर्णय लेने की प्रक्रिया में बदलावों का सामना किया है, जिससे उनकी बैलेंस शीट अधिक विश्वसनीय बन गई है। इसका मतलब यह नहीं है कि भविष्य में कोई एनपीए नहीं होगा, लेकिन तथ्य यह है कि एनपीए के अचानक बढ़ने की संभावना कम हो गई है।

आइए देखें कि पिछले नौ वर्षों में पीएसयू बैंकिंग क्षेत्र में क्या हुआ है।

इस रिपोर्ट के उद्देश्य से सूची को सबसे अधिक संभावित स्टॉक के साथ क्रमबद्ध किया गया है।

 पीएसयू बैंक स्टॉक - अपसाइड संभावित

1 अप्रैल, 2024

कंपनी का नाम

नवीनतम औसत स्कोर

रेको

विश्लेषक गणना

* अपसाइड संभावित %

इंस्ट स्टेक %

मार्केट कैप टाइप

1 सप्ताह का रिटर्न %

1 मिलियन का रिटर्न %

3 मिलियन का रिटर्न %

1 वर्ष का रिटर्न %

बैंक ऑफ इंडिया

8

खरीदें

4

24.0

14.1

बड़ा

1.8

3.4

20.8

91.5

बैंक ऑफ बड़ौदा

10

खरीदें

27

19.3

23.2

बड़ा

3.3

0.9

13.4

64.3

यूनियन बैंक ऑफ इंडिया  भारत

10

खरीदें

10

17.3

11.5

बड़ा

4.6

9.0

30.3

149.2

केनरा बैंक

10

खरीदें

15

15.3

20.6

बड़ा

3.0

5.6

31.7

111.2

इंडियन बैंक

10

खरीदें

10

15.2

16.6

बड़ा

5.8

-1.7

23.4

85.8

विश्लेषकों द्वारा दिए गए उच्चतम मूल्य लक्ष्य से गणना की गई।

source: et 

Jharkhand48

Apr 02 2024, 10:10

स्टॉक रडार: एलएंडटी कप एंड हैंडल पैटर्न से बाहर निकला; स्टॉक के 4,000 के स्तर पर पहुंचने की संभावना:

एलएंडटी स्टॉक एक महीने में 8% से अधिक चढ़ा, लेकिन पिछले 5 ट्रेडिंग सत्रों में 5% से अधिक चढ़ा। इससे स्टॉक को दैनिक चार्ट पर कप एंड हैंडल पैटर्न से बाहर निकलने में मदद मिली। इस ब्रेकआउट ने स्टॉक के 4,000 के स्तर की ओर बढ़ने की गुंजाइश खोली है। ट्रेडर्स स्टॉक को 3,700 के स्तर से ऊपर जमा कर सकते हैं। पैटर्न की नेकलाइन 3,650 रुपये से ऊपर रखी गई थी।

इंफ्रास्ट्रक्चर सेक्टर का हिस्सा लार्सन एंड टुब्रो लिमिटेड पिछले महीने रेंजबाउंड रहा, लेकिन हाल ही में कीमत में उतार-चढ़ाव ने स्टॉक को दैनिक चार्ट पर कप एंड हैंडल पैटर्न से बाहर निकलने में मदद की।

विशेषज्ञों ने सुझाव दिया कि अल्पकालिक ट्रेडर्स 3-4 सप्ताह में 4,000 रुपये के संभावित लक्ष्य के लिए अभी स्टॉक खरीदने पर विचार कर सकते हैं।

 गति को ट्रैक करते हुए, एसएंडपी बीएसई सेंसेक्स इंडेक्स स्टॉक ने 28 मार्च, 2024 को 3,812 रुपये का रिकॉर्ड उच्च स्तर हासिल किया। एलएंडटी स्टॉक, जो एसएंडपी बीएसई सेंसेक्स इंडेक्स का भी हिस्सा है, एक महीने में 8% से अधिक बढ़ा, लेकिन पिछले 5 ट्रेडिंग सत्रों में 5% से अधिक की तेजी आई, जिससे स्टॉक को कप और हैंडल से बाहर निकलने में मदद मिली। 5paisa.com के प्रमुख शोध रुचित जैन ने कहा, "पूंजीगत सामान क्षेत्र ने बाजार के हालिया सुधारात्मक चरण में अच्छा प्रदर्शन किया है और इस क्षेत्र के शेयरों में अच्छी मात्रा के समर्थन से मूल्य-वृद्धि देखी गई है।" उन्होंने कहा, "एलएंडटी ने अच्छे वॉल्यूम के साथ दैनिक चार्ट पर कप और हैंडल पैटर्न से बाहर निकलने का मौका दिया है। आरएसआई ऑसिलेटर ने भी सकारात्मक क्रॉसओवर दिया है और इसलिए, हमें उम्मीद है कि स्टॉक अल्पावधि में तेजी दिखाएगा।"  "व्यापारी 4,000 रुपये के संभावित लक्ष्य के लिए 3,750-3,730 रुपये की सीमा में शेयर खरीदने पर विचार कर सकते हैं।

source: et 

Jharkhand48

Apr 02 2024, 09:16

Safety vs. competitive pricing: Why India-made cars fail global crash tests:

In India, priority is always given to keeping the cost of a vehicle low. So, even though cars made in India meet all the local safety requirements, they fail to pass high global standards. The needle on safety will move only if the Bharat NCAP crash tests are made mandatory for all cars in India.

The Citroen e-C3 SUV is the latest made-in-India car to crash land (no pun intended). The electric car secured a zero-star rating in crash test for adult occupant protection from Global NCAP (New Car Assessment Program) recently. The Citroen e-C3 SUV is made in Tamil Nadu since its launch last February.

Its maker Stellantis, however, claimed that "its vehicles comply with all current local market regulations" and the company will be adding six airbags and additional safety features as standard across its products in India in the second half of the year.

The crash test revealed that the driver's chest showed "weak protection" while the passengers' chest had "poor protection".

The Citroen e-C3 joined a bunch of India-made cars that received poor safety ratings from various crash-test agencies. In the past, Maruti Suzuki WagonR, Swift, S-Presso; Renault Kwid; Hyundai i10, and many other cars flunked crash tests.

Saurabh Dalela director, International Centre for Automotive Technology (ICAT) tells that the car has its mass and velocity, so a frontal crash test is done to check how the huge energy produced on collision is absorbed by the vehicle. If it is not absorbed in a controlled manner by the vehicle, then it will impact the safety of people sitting in the car. The technology of energy absorption is a feature of the vehicle structure and mater For example, the crumple zone at the front of the vehicle and high-strength material in the vehicle structure
(high-strength steel) are the key features to absorb high energy efficiently during a crash. Further, restraint systems such as seat belts and airbags provide additional protection to the occupants.

"In India, priority was always given to keeping the cost of the vehicle competitive," says Piparsania, explaining why cars made in the country are low on safety.

Dalela flags another important factor that is key to a vehicle's safety. He says since the sheet metal of the car plays a major role in absorbing the kinetic energy produced on collision, the design aspect of the car becomes important, besides the quality of the sheet metal used in the vehicle's body structure, including its physical and chemical properties.

When the international car brands came to India, their cars were engineered for different automotive standards around the world. And in India, the automotive standards were not so evolved at that time. So, the industry's dilemma was whether the cars should be made for safety, or should they follow the minimum certification standard, Piparsania adds.

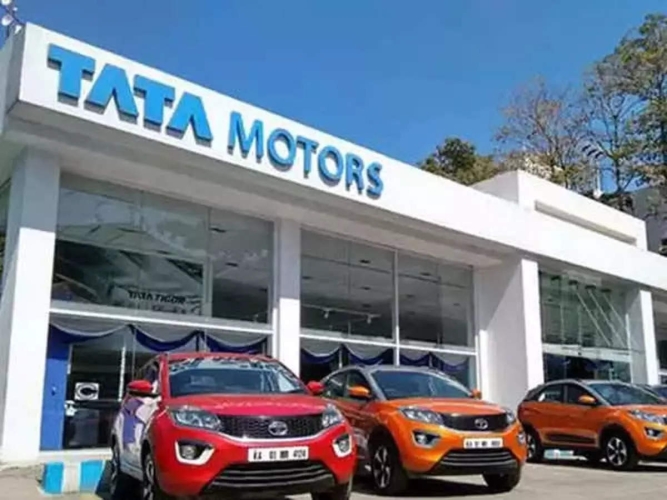
He says several vehicle manufacturers are now looking to export their models from India. For instance, Tata Motors and Mahindra are now exporting their vehicles around the world. So, they are adopting global standards that can be harmonised for the rest of the world.

source: et 

Jharkhand48

Apr 02 2024, 09:13

Stock Radar: L&T breaks out from Cup & Handle pattern; stock likely to hit 4,000 levels:

The L&T stock rose over 8% in a month but rallied more than 5% in the last 5 trading sessions. This helped the stock breakout from a Cup and Handle pattern on the daily chart. The breakout has opened room for the stock to head towards 4,000 levels. Traders can accumulate the stock above 3,700 levels. The neckline of the pattern was placed above Rs 3,650.

Larsen & Toubro Ltd, a part of the infrastructure sector, remained rangebound in the past month, but the recent price action helped the stock break out from a Cup & Handle pattern on the daily chart.

Short-term traders can look to buy the stock now for a possible target of Rs 4,000 in 3-4 weeks, suggested experts.

Tracking the momentum, the S&P BSE Sensex index stock hit a record high of Rs 3,812 on March 28, 2024.

L&T stock, which is also a part of the S&P BSE Sensex index, rose more than 8% in a month but rallied over 5% in the last 5 trading sessions, which helped the stock breakout from a Cup and Handle.

"The capital goods sector has shown a decent outperformance in the recent corrective phase of the market and stocks within this sector have witnessed price-up moves supported by good volumes," said Ruchit Jain, lead research, 5paisa.com.

"L&T has given a breakout from a Cup & Handle pattern on the daily chart with good volumes. The RSI oscillator has also given a positive crossover and hence, we expect the stock to rally in the short term," he said.

"Traders can look to buy the stock in the range of Rs 3,750-3,730 for a potential target around Rs 4,000. 

source: et 

Jharkhand48

Apr 02 2024, 09:09

Stock picks: 4 stocks with consistent score improvement and upside potential of up to 41%:

Once again everything is looking green, the way FY 25 has started, it appears that bulls were on short term break due to tight liquidity conditions which tends to appear in the last month of every financial year. While the local liquidity condition might improve, the issue of high valuation is still not over. It is still a time to be cautious in terms of not going overboard with taking exposure to a certain stock, selective about what one is buying. The reason, if the street becomes selective and gets into correction mode once again, it is stocks where there has been improvements in the business operating matrix will be able to weather the storm better. These selected stocks depict a strong upward trajectory in their overall average score which is based on five key pillars ie earnings, fundamentals, relative valuation, risk and price momentum. This implies that there has been a significant improvement in their market outlook in the given time frame.

As compared to market cycles, fundamentals of an industry have different cycles. So while the market might be bullish, don't ignore what is happening on the fundamentals of an industry as that will finally determine the stock price. How can margins of an FMCG company which is focussed on food and beverage space, improve at a time when sugar and other agro commodities prices are moving upward. Because, these commodities are the basic raw materials of these companies. This is clearly visible on the street also, as these stocks stayed in a relative underperformance mode even when bulls were seen on every corner of the street.

On the other hand, metal prices have remained subdued for some time. Which means that while metal companies may not see a sharp jump in their bottomline when they announce their Q4 result but given the fact that there has been a recent uptick in metal prices, it is likely that when they announced their Q1 result for FY 25, there could be an improvement in their margins.

We have curated a list of stocks which show an improvement in their average score in a 1-month time frame. The selected list applies different algorithms for all BSE and NSE stocks.

Top Picks of the week

Apr 1, 2024

Stock Score 1W ago

Stock Score 1M ago

Latest Stock Score

Company Name

Reco

Analyst Count

 Upside Potential (%)

1Y Returns %

Inst Stake (%)

Market Cap Type

Market Cap Rs Cr

IDFC First Bank

10

9

7

Buy

17

41.9

42.9

20.0

Large

53,300

Poonawalla Fincorp

7

6

5

Buy

8

33.2

64.9

7.0

Large

36,055

Happy Forgings

Strong Buy

6

5

0

2

27.0

0.0

7.3

Mid

8,367

Ethos Ltd

9

8

6

Buy

2

10.2

170.2

21.0

Mid

6,333

Calculated from highest price target given by analysts

source: et 

Jharkhand48

Apr 02 2024, 09:05

5 PSU banks with an upside potential of up to 24%:

In March's market correction, the initial correction was led by PSUs. Both PSU banks & non-bank PSU. Given that both sets of gained sharply, profit booking was natural. But if one looks at the broader contours it is clear that while the PSU banks corrected. the magnitude of the correction was not very high. For example, if after gaining over 100% in 2023, the stock corrects 10-15%, it is a bullish sign and not bearish. If one looks at the table, in all time frames the selected PSUs have delivered positive returns except in one stock where 1-month returns are negative. This trend is normally witnessed when there is more delivery-based buying based on positive fundamental changes. As the economy continues to move on a path of higher growth, they probably are the best to play the theme, if you are able shed historical baggage which sometimes hit the Street.

While PSU banks stocks have been doing well for more than an year, it was the divergence between the performance in the PSU and private sector banks which has brought more limelight on PSU banks.

Given the fact that stocks have done well and comparisons are bound to be made with the fact that just a year back they were quoting at much below what they are quoting today, will this performance sustain. Recently when there was an overall correction in the market, these PSU banks also saw a decline. But if one looks at the broader contours of correction it is very clear that while the PSU banks corrected, but the magnitude of the correction was not very high. For example, if after gaining more than 100% in the last one year, the stock corrects 10 to 15% it is rather a bullish sign and not a bearish one. In Fact if one looks at the table, in all time frames the selected PSU stocks have been able to deliver positive returns except in on stock where one month returns are negative. This trend is normally witnessed when there is more delivery based buying based on positive change in fundamentals of a sector, which has been the case with PSU banks.

The fact that these banks have gone through a process of restructuring and reconstruction for almost nine years, through which they have braved Covid, mergers and changes in process in how the decisions in terms of lending are made their balance sheets much more believable. This is not to say that in future there would be no NPA's but the fact is the probability of the sudden shock of NPA's shooting up has gone down.

Let's look at what has happened to the PSU banking space in the last nine years.

For the purpose of this report the list has been sorted with the highest potential stock coming on the top of the list.

PSU Bank stocks - Upside potential

Apr 1, 2024

Company Name

Latest Avg Score

Reco

Analyst Count

* Upside Potential %

Inst Stake %

Market Cap Type

1Wk Returns %

1M Returns %

3M Returns %

1Y Returns %

Bank of India

8

Buy

4

24.0

14.1

Large

1.8

3.4

20.8

91.5

Bank of Baroda

10

Buy

27

19.3

23.2

Large

3.3

0.9

13.4

64.3

Union Bank of India

10

Buy

10

17.3

11.5

Large

4.6

9.0

30.3

149.2

Canara Bank

10

Buy

15

15.3

20.6

Large

3.0

5.6

31.7

111.2

Indian Bank

10

Buy

10

15.2

16.6

Large

5.8

-1.7

23.4

85.8

Calculated from highest price target given by analysts

source: et 

Jharkhand48

Apr 02 2024, 09:03

Tata Motors boards Chennai express, reaches Hyundai's doorstep with an INR9,000 crore plant:

Tata Motors officials with Tamil Nadu Chief Minister MK Stalin after signing an Mou to set up a vehicle manufacturing facility at an investment of INR9/000 crore on March in Cherinal, image credit: Agencies:

Tata Motors' passenger vehicle operations have so far been clustered in West India. What takes the automaker to Ranipet near Chennai? Will this investment bring long-term benefit to the company?

The monthly report released by the Federation of Automobile Dealers Associations (FADA) on March 7 had yet another good news for Tata Motors loyalists. It showed that in February, Tata Motors was almost equal to Hyundai Motor India in monthly retail passenger vehicle sales. In the previous three months, Tata Motors had surpassed Hyundai's retail sales to become number 2 after Maruti Suzuki. In terms of the overall retail market in February, Tata had a 13.57% share, right behind Hyundai (14.08%). Maruti Suzuki was as usual on top with a market share of 39.74%.

While Tata Motors has been running neck and neck with Hyundai, the South Korean rival always manages to fight its way back. In that context, Tata Motors' recent announcement to invest INR9,000 crore to set up a vehicle manufacturing facility in Ranipet in Tamil Nadu can add more firepower to its ammo. Last May Hyundai said it would invest INR20,000 crore in Tamil Nadu over 10 years for growing its electric vehicle ecosystem including battery manufacturing.

While Tata Motors has not shared any details on what kind of vehicle it will be making in the new plant, sources aware of the development say that passenger vehicle manufacturing is almost certain. Some components of commercial vehicles could also be made there for which fine prints are still being worked out.

This means Tata Motors has sufficient passenger vehicle capacity between the three plants.

Is Tata's move triggered by Hyundai's expansion to west India with the acquisition of General Motors' Talegaon facility in Maharashtra?

Why Tamil Nadu?

Experts say Tata Motors' investment in Tamil Nadu shows the company is getting ready for the potential growth of the automobile market in India as well as its own growth in the industry half a decade down the line.

VG Ramakrishnan, managing partner at consulting firm Avanteum Advisors, points out that manufacturing investments are far too expensive to use for just taking on a competitor. "I don't see this investment from a market share perspective. Irrespective of manufacturing locations, companies have captured market share. Hyundaiis an example of that," he adds. Hyundai's operations had so far been limited to Chennai, but it has been successful in capturing market share pan India as a mass-market brand.

"Tata Motors' proposed investment in Tamil Nadu shows the confidence behind its strategy and sustainability of its turnaround in the passenger vehicles space," Ramakrishnan explains. He lists out various benefits that multiple plant locations bring about for an automaker.

source:et 

Jharkhand48

Apr 01 2024, 09:32

सिर्फ स्वाद नहीं, इंद्रियों का दोहन: इंद्री और अन्य भारत निर्मित सिंगल माल्ट को वैश्विक सम्मान मिलता है:

 पिकाडिली डिस्टिलरीज सिंगल माल्ट ब्रांड इंद्री ने माल्ट में डबल गोल्ड बेस्ट इन शो जीता है।  पीटा हुआ।  अमेरिका स्थित व्हिस्की ऑफ द वर्ल्ड अवार्ड में श्रेणी।  इंद्री के अलावा, चार अन्य भारतीय आत्माओं को शीर्ष सम्मान प्राप्त हुआ।  लंबे समय तक अपने स्वयं के प्रीमियम एल्कोबेव ब्रांडों वाले देश के रूप में नहीं जाना जाने वाला भारत निश्चित रूप से एक लंबा सफर तय कर चुका है।

 पहला घूंट स्वर्ग जैसा स्वाद देता है।  दूसरा आपको वहां ले जाता है.

 यह ज्यादातर स्पिरिट के साथ सच है, लेकिन एक अच्छी व्हिस्की, विशेष रूप से सिंगल माल्ट, एक ऐसा अनुभव है जो सभी पांच इंद्रियों को छूता है।  और अपनी श्रेणी में सर्वश्रेष्ठ में से कुछ भारत निर्मित हैं, यह तथ्य वैश्विक स्तर पर सिद्ध हो चुका है

 हरियाणा स्थित पिकाडिली डिस्टिलरीज के इंद्री दिवाली कलेक्टर संस्करण 2023 सिंगल माल्ट ने यूएस-आधारित व्हिस्की ऑफ द वर्ल्ड अवार्ड में माल्ट: पीटेड श्रेणी में "डबल गोल्ड बेस्ट इन शो" जीता है।

 जीत के बाद से, कंपनी के शेयर की कीमत 10 जनवरी, 2023 को INR45.25 से बढ़कर 5 जनवरी, 2024 को INR263.75 हो गई है।

 "तरल वास्तव में अच्छा है। गुरुग्राम में जहां खुदरा विक्रेताओं की आम तौर पर अपनी एमआरपी होती है, और केवल एमएसपी निर्माताओं द्वारा निर्धारित किया जाता है, पुरस्कार जीतने के आसपास सोशल मीडिया उन्माद के बाद बोतल की कीमत आसमान छू गई। मैंने कोशिश की, और मुझे खुशी है  कहते हैं, यह एक बेहतरीन व्हिस्की है,'' दिल्ली स्थित पेय प्रशिक्षण और परामर्श फर्म टुलीहो के संस्थापक विक्रम अचंता कहते हैं।

 स्पष्ट रूप से, जबकि मूल्य खंड को प्राथमिकता देने वाली भारतीय आबादी अधिकांश मांग रखती है, उन लोगों के बीच धीमी गति से बदलाव हो रहा है जो बहुत अधिक पीने के बजाय गुणवत्तापूर्ण पेय पसंद करते हैं।  क्या यह वह दशक हो सकता है जहां भारतीय व्हिस्की अपने जापानी समकक्ष की तरह वैश्विक सुर्खियों का आनंद उठा सकें?

source: et 

Jharkhand48

Apr 01 2024, 09:30

भौतिक खुदरा स्टोर ख़त्म नहीं हो रहा है, बल्कि धूम मचा रहा है:

 महामारी के दौरान ई-कॉमर्स का दिन धूप में बीता।  हालाँकि, लोगों के अपने घरों की सीमा से बाहर आने के साथ, भौतिक खुदरा स्टोर फल-फूल रहे हैं और अगले कुछ वर्षों में भी ऐसा जारी रहेगा, तो, अंतर्निहित ड्राइवर क्या हैं और प्रारूप के लिए आगे क्या है?

 भौतिक खुदरा स्टोर का भाग्य पिछले कुछ वर्षों से चर्चा का विषय रहा है।  जब लोग अपने घरों तक ही सीमित थे, तब ई-कॉमर्स चरम पर पहुंच गया।  जैसे ही कुछ साल पहले लोग महामारी से बाहर निकले, स्टोर ने शानदार वापसी की।  लेकिन सवाल यह बना रहा: क्या यह 'बदला लेने' की कहानी थी या यह अधिक मौलिक थी?

 इसमें कोई संदेह नहीं है कि एक भौतिक स्टोर किसी भी खुदरा और उपभोक्ता कंपनी की चैनल रणनीति का केंद्र है।  शोध एजेंसी सीबीआरई के अनुसार, खुदरा क्षेत्र की स्टोर लीजिंग में पिछले वर्ष की तुलना में 2023 के पहले नौ महीनों में -46% की वृद्धि हुई है।  यह एक ऐसी घटना है जो सभी क्षेत्रों में चल रही है।

 सबसे बड़ा नाम जो हमारे दिमाग में आता है वह उद्यमिता बूम के पूर्व-प्रिय बायजू का है, जिसने भारी शर्त लगाई थी कि शिक्षा का भविष्य मुख्य रूप से ऑनलाइन होगा।  लेकिन वह दांव चल नहीं पाया.  अपने स्वयं के अनुभव से, मैं प्रमुख आईआईएम में कार्यकारी शिक्षा पढ़ाता हूं, और यह हमेशा व्यक्तिगत रूप से होता है, ऑनलाइन नहीं।

 भौतिक स्टोर स्थान में निवेश लगभग हर जगह है।  उदाहरण के लिए, फ्रांसीसी स्पोर्ट्स रिटेलर दिग्गज डेकाथलॉन शहरी भारत में अपने स्टोर का विस्तार कर रहा है।  जबकि रिलायंस रिटेल टियर-II और टियर-III शहरों में 500 से अधिक वैल्यू स्टोर लेकर आ रहा है।

 ओमनी-चैनल एक अत्यधिक उपयोग किया जाने वाला शब्द है लेकिन भविष्य में सोशल कॉमर्स के तेजी से बढ़ने की संभावना है।  इसका एक तत्व यह है कि खुदरा खिलाड़ी अपने भौतिक स्टोर पर ट्रैफ़िक और अनुभव बढ़ाने के लिए एक आभासी प्रभावशाली व्यक्ति का उपयोग कर सकते हैं।  उदाहरण के लिए, वर्चुअल इन्फ्लुएंसर लू डो मगालु के फेसबुक पर 14 मिलियन से अधिक फॉलोअर्स, इंस्टाग्राम पर 6 मिलियन फॉलोअर्स और यूट्यूब पर 2.6 मिलियन से अधिक फॉलोअर्स हैं।  वह ब्राज़ीलियाई खुदरा दिग्गज लुइज़ा की ओर से उपभोक्ताओं के साथ सक्रिय रूप से जुड़ती है क्योंकि वह उत्पाद समीक्षा, अनबॉक्सिंग और एक समुदाय का निर्माण करने पर चर्चा करती है। 

Jharkhand48

Apr 01 2024, 09:26

44% तक की तेजी की संभावना वाले 6 चीनी स्टॉक:

 यदि किसी को चीनी उद्योग के इतिहास पर नजर डालनी हो।  दो चीजें सामने आएंगी, उनकी बैलेंस शीट डेटिट से ग्रस्त थी।  इस पर कर्ज क्यों डाला गया क्योंकि यह एक ऐसा उद्योग है जहां नीतिगत और राजनीतिक हस्तक्षेप सबसे ज्यादा था।  दूसरा, जब चुनाव करीब आते थे तो कंपनियां डर जाती थीं।  वजह साफ है, वोट बैंक को खुश करने के लिए ऐसी घोषणाएं होंगी, जिससे उद्योग जगत पर दबाव बनेगा। 

 सबसे ऊपर है न्यूनतम समर्थन मूल्य (एमएसपी) या उचित लाभकारी मूल्य में बढ़ोतरी, जैसा कि इस नाम से भी कहा जाता है।  यह अनिवार्य रूप से न्यूनतम मूल्य है जिस पर चीनी मिलों को किसानों से गन्ना खरीदना होता है।  लेकिन पिछले दस वर्षों में चीजें बेहतरी की ओर बदल गई हैं और कर्ज के आंकड़े तथा स्टॉक की कीमतें भी यह स्पष्ट रूप से दिखा रही हैं।  चुनाव के समय नीति में कोई मनमाना परिवर्तन नहीं होता है।  सवाल यह है कि क्या कर्ज की स्थिति बेहतर होने से इस बार री रेटिंग मजबूत होगी?

 ऐसे क्षेत्र में, जहां सरकारी नीतियों का बड़ा प्रभाव होता है, नीति में किसी भी बदलाव का खिलाड़ियों पर प्रभाव पड़ने का जोखिम हमेशा मौजूद रहता है।  यही कारण है कि ऐसे क्षेत्रों के शेयरों का मूल्यांकन एक निश्चित सीमा को पार नहीं करता है।  संभवतः चीनी क्षेत्र ऐसे क्षेत्रों की सूची में सबसे ऊपर है और इसका कारण यह है कि नीति निर्माण में केंद्र और राज्य दोनों सरकारों की कुछ भूमिका होती है।

 लेकिन पिछले कुछ वर्षों में, चीजों में सुधार हुआ है और यही कारण है कि चीनी स्टॉक, जो चुनावों की घोषणा से पहले बहुत तेजी से प्रभावित होता था, इस बार उस तरह की गिरावट नहीं देखी गई है।  हां, उचित लाभकारी मूल्य (एफआरपी) में वृद्धि हुई है जो कंपनियों को किसानों को देना पड़ता है।  लेकिन इस तथ्य को देखते हुए कि चीनी उद्योग अब सिर्फ चीनी से कहीं अधिक है, यह स्वच्छ ऊर्जा पारिस्थितिकी तंत्र का हिस्सा है, यही कारण है कि इस वृद्धि का इन शेयरों पर कोई प्रभाव नहीं पड़ा।  अब अगर इसके पीछे वह घटना है जो ऐतिहासिक रूप से शेयरों को नीचे लाने वाली घटना रही है तो जब भी बाजार की धारणा में सुधार होगा तो इन शेयरों की वापसी की संभावना अधिक है।

 वापसी की संभावना स्थिर रहने का एक और कारण यह है कि बैलेंस शीट की गुणवत्ता दस साल पहले की तुलना में कहीं बेहतर है।  देखने वाली एक साधारण बात लंबी अवधि में ऋण इक्विटी अनुपात में रुझान है।  नीचे दिया गया चार्ट दिखाता है कि सेक्टर के लिए चीजें कैसे बदल गई हैं।  छह कंपनियों में से प्रत्येक के ऋण इक्विटी अनुपात में गिरावट देखी गई है।  2014 और 2023 में ऋण इक्विटी अनुपात के स्तर को देखें। चीजें कैसे बदल गई हैं, इसका इससे बेहतर संकेतक कोई नहीं हो सकता
 अच्छे के लिए।

 चीनी स्टॉक - तेजी की संभावना

 मार्च 28, 2024

 कंपनी का नाम

 धामपुर चीनी मिलें

 नवीनतम औसत स्कोर

 9

 रेको

 विश्लेषक गणना

 1

 उपरी संभावना %

 60.3

 उदाहरण हिस्सेदारी%

 3.6

 मार्केट कैप प्रकार

 छोटा

 बाजार पूंजीकरण करोड़ रु

 1,408

 कंपनी का नाम

 द्वारिकेश शुगर इंडस्ट्रीज

 नवीनतम औसत स्कोर

 8

 रेको

 खरीदना

 विश्लेषक गणना

 4

 उपरी संभावना %

 44.9

 उदाहरण हिस्सेदारी %

 मार्केट कैप प्रकार

 1.8

 छोटा

 बाजार पूंजीकरण करोड़ रु

 1,386

 कंपनी का नाम

 डालमिया भारत शुगर एंड इंडस्ट्रीज

 नवीनतम औसत स्कोर

 10

 रेको

 खरीदना

 विश्लेषक गणना

 1

 उपरी संभावना %

 42.6

 उदाहरण हिस्सेदारी %

 0.5

 मार्केट कैप प्रकार

 छोटा

 बाजार पूंजीकरण करोड़ रु

 2,781

 कंपनी का नाम

 बलरामपुर चीनी मिल्स

 नवीनतम औसत स्कोर

 8

 रेको

 खरीदना

 विश्लेषक गणना

 7

 31.7

 उपरी संभावना%

 उदाहरण हिस्सेदारी %

 29.9

 मार्केट कैप प्रकार

 मध्य

 बाजार पूंजीकरण करोड़ रु

 7,300

 कंपनी का नाम

 ईआईडी-पैरी (भारत)

 नवीनतम औसत स्कोर

 10

 रेको

 मजबूत खरीदें

 विश्लेषक गणना

 1

 उपरी संभावना %

 28.9

 उदाहरण हिस्सेदारी %

 18.6

 मार्केट कैप प्रकार

 मध्य

 बाजार पूंजीकरण करोड़ रु

 9,685

 कंपनी का नाम

 त्रिवेणी इंजीनियरिंग और उद्योग

 नवीनतम औसत स्कोर

 8

 रेको

 खरीदना

 विश्लेषक गणना

 5

 उपरी संभावना %

 24.4

 उदाहरण हिस्सेदारी %

 10.4

 मार्केट कैप प्रकार

 मध्य

 बाजार पूंजीकरण करोड़ रु

 6,883

source: et